
Advanced LiDAR Point Cloud Processing Software
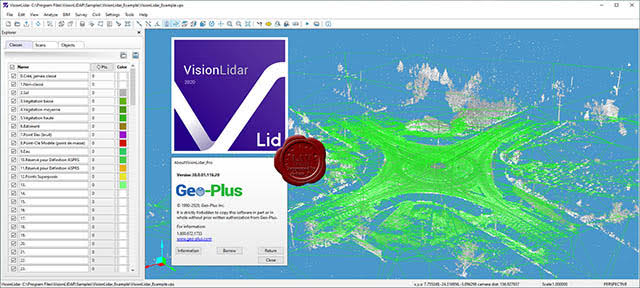
ADVANCED POINT CLOUD PROCESSING FEATURES
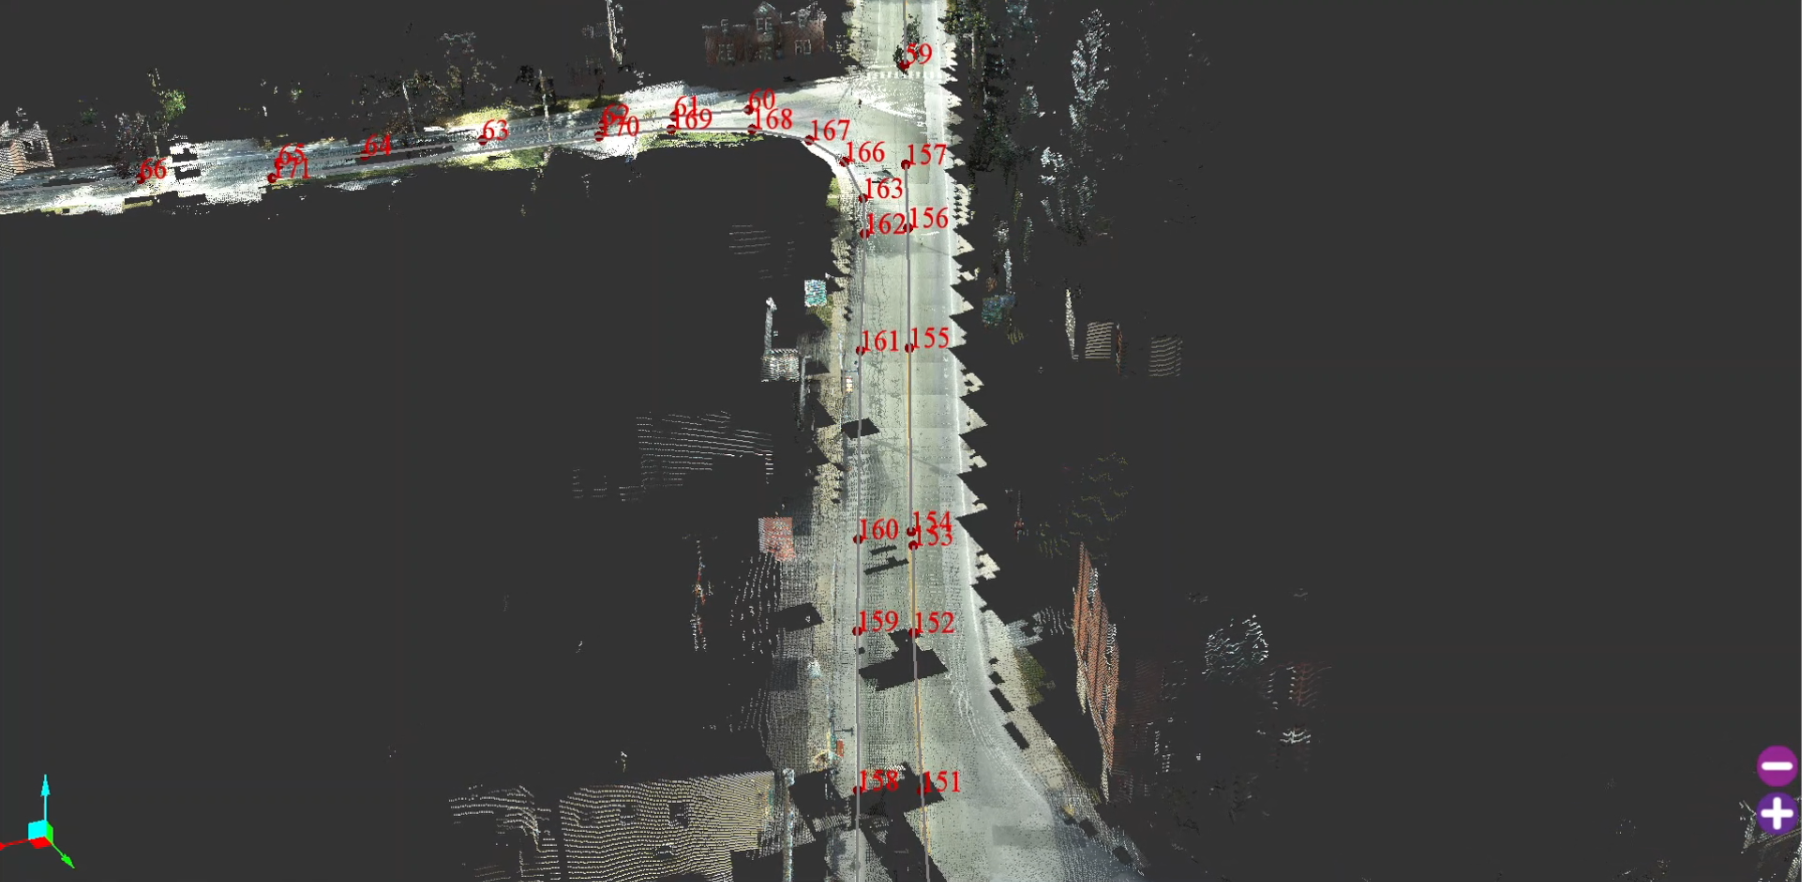
CAD/GIS Integration Tools
- The plugin integrates natively with AutoCAD MAP, AutoCAD, Civil 3D, ArcGIS, Microstation, Powerdraft and BricsCAD. Engineers work directly within their preferred CAD/GIS platform without switching between separate software applications
- Users can customize viewing angles and visualize 3D point cloud data directly within the CAD environment. All measurement and evaluation operations are performed on the original data layer without intermediate conversion
- Processed data can be exported to DXF format for use in AutoCAD or SHP format for integration into GIS planning systems
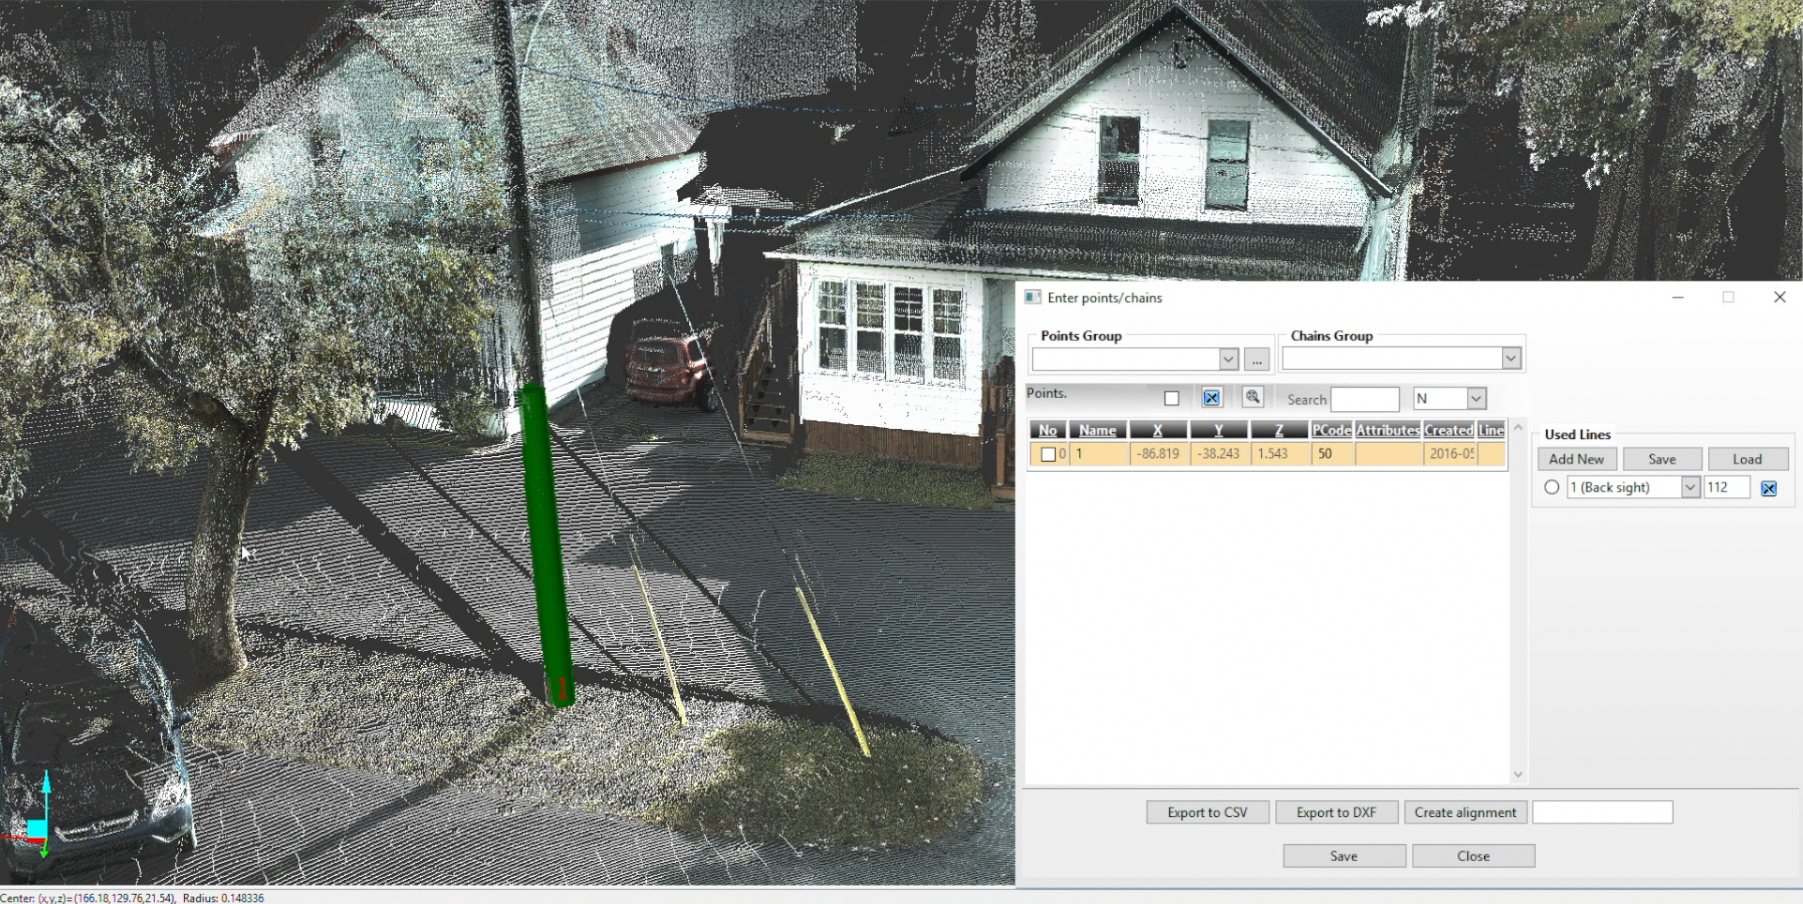
Deep Learning & Automated Classification
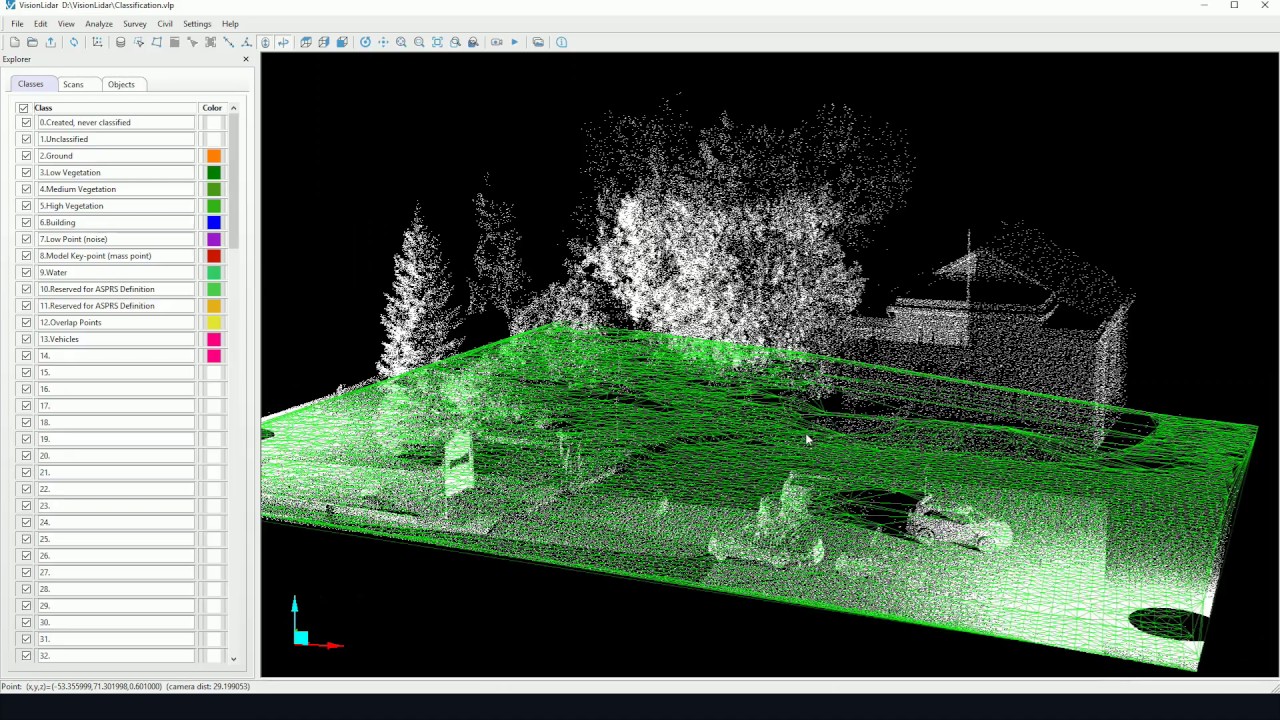
- Deep learning technology automatically classifies objects within point clouds. Users can train custom models for each type of LiDAR sensor in use
- Automated processing tools include noise reduction, point classification and feature extraction. This streamlined workflow eliminates unwanted points and isolates important objects in just a few operations
- Advanced object recognition tools deliver classification speeds 3 times faster than traditional manual methods
Advanced 3D Visualization
- Display data by RGB color codes, scan route, point density, classification layer or elevation. Each mode reveals different information from the same dataset
- 360-degree spherical images are integrated directly into the 3D interface. Users can explore and analyze objects without leaving the software environment
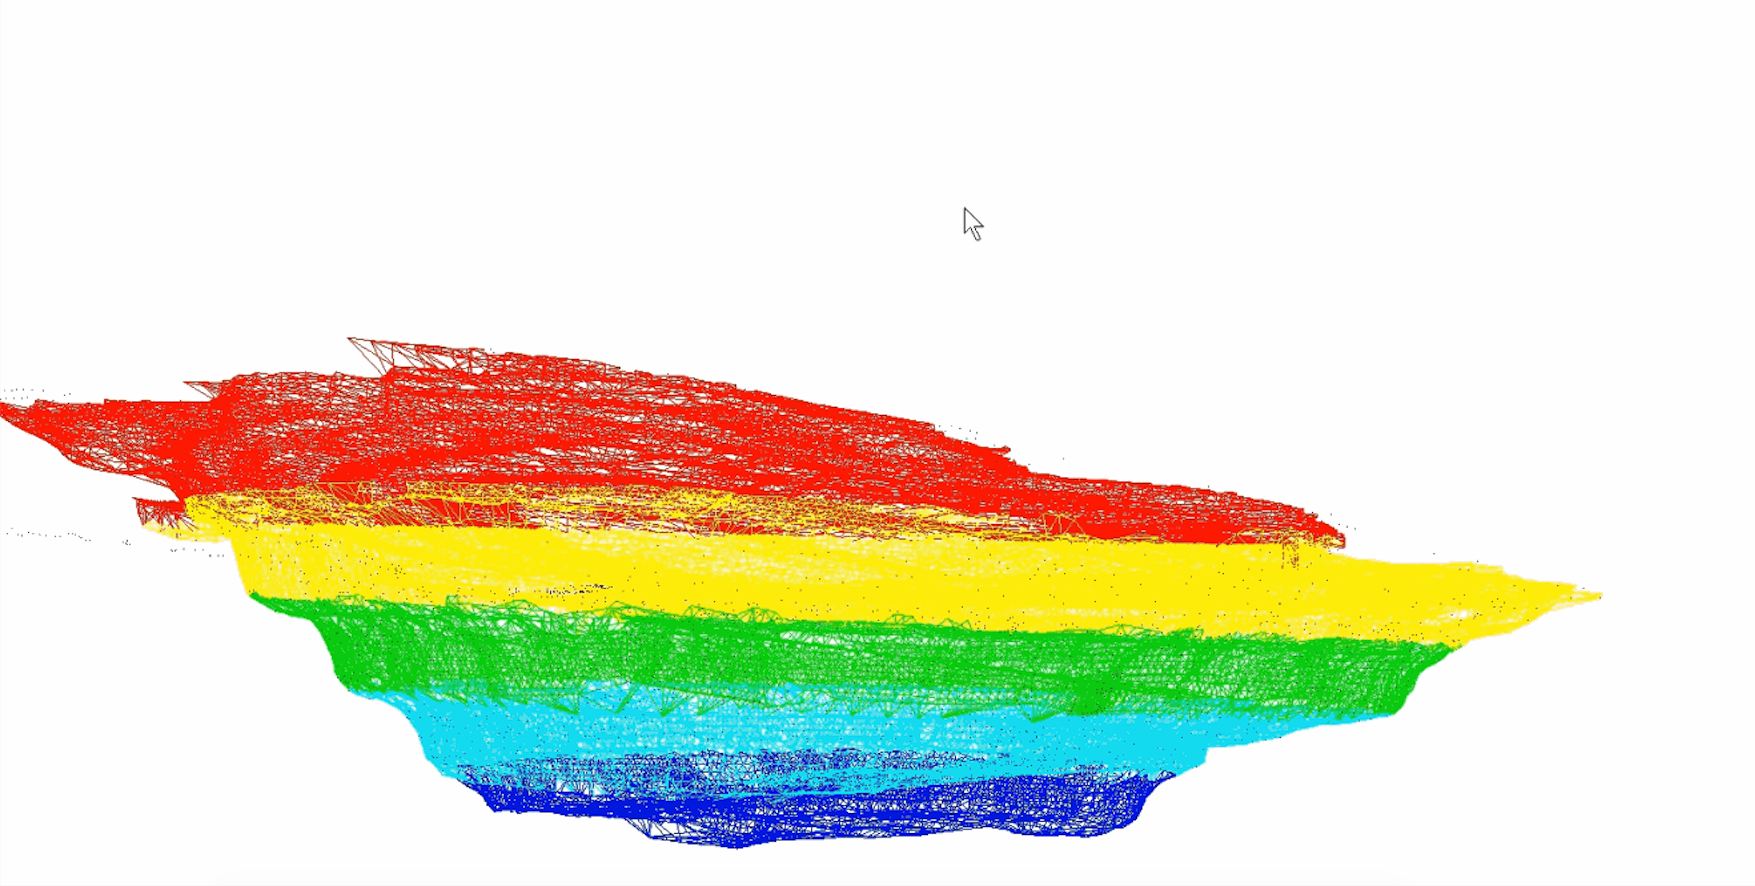
Advanced 3D Visualization
- Display data by RGB color codes, scan route, point density, classification layer or elevation. Each mode reveals different information from the same dataset
- 360-degree spherical images are integrated directly into the 3D interface. Users can explore and analyze objects without leaving the software environment
Digitization & Feature Extraction Tools
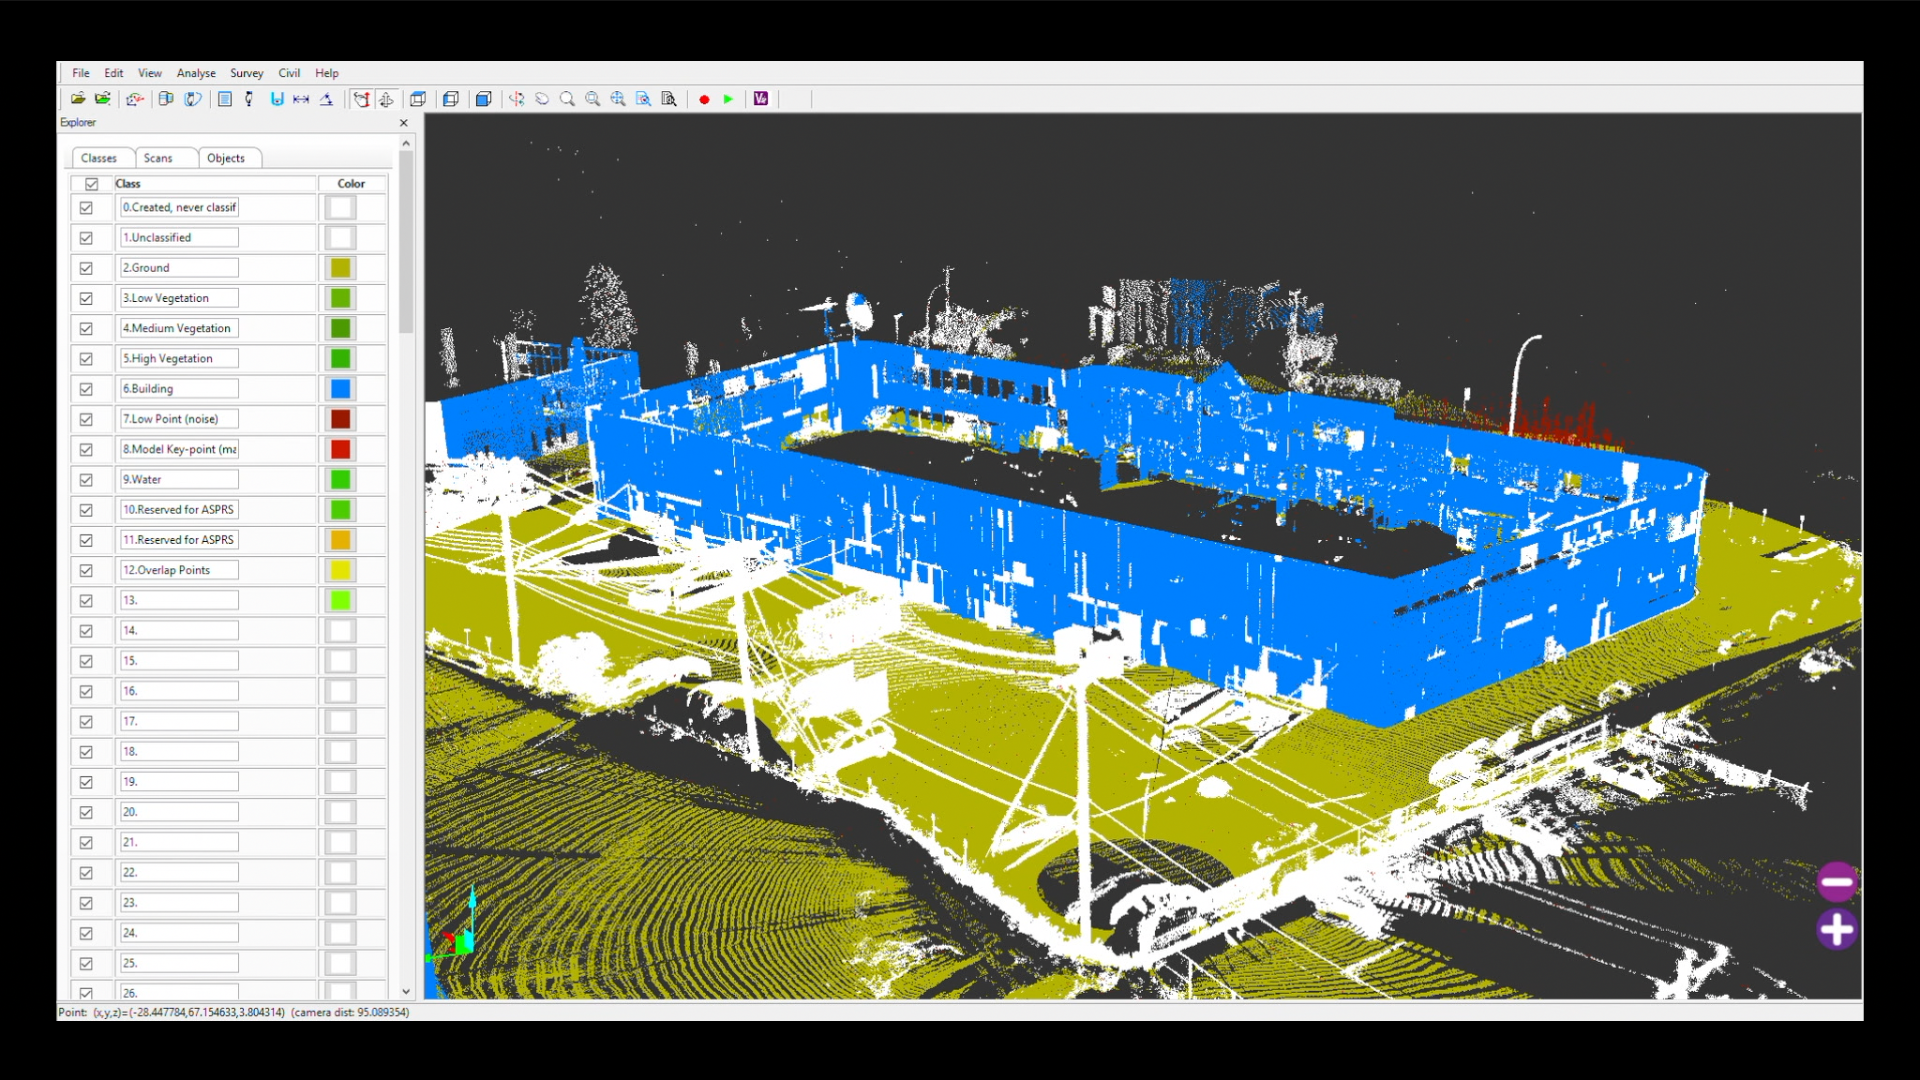
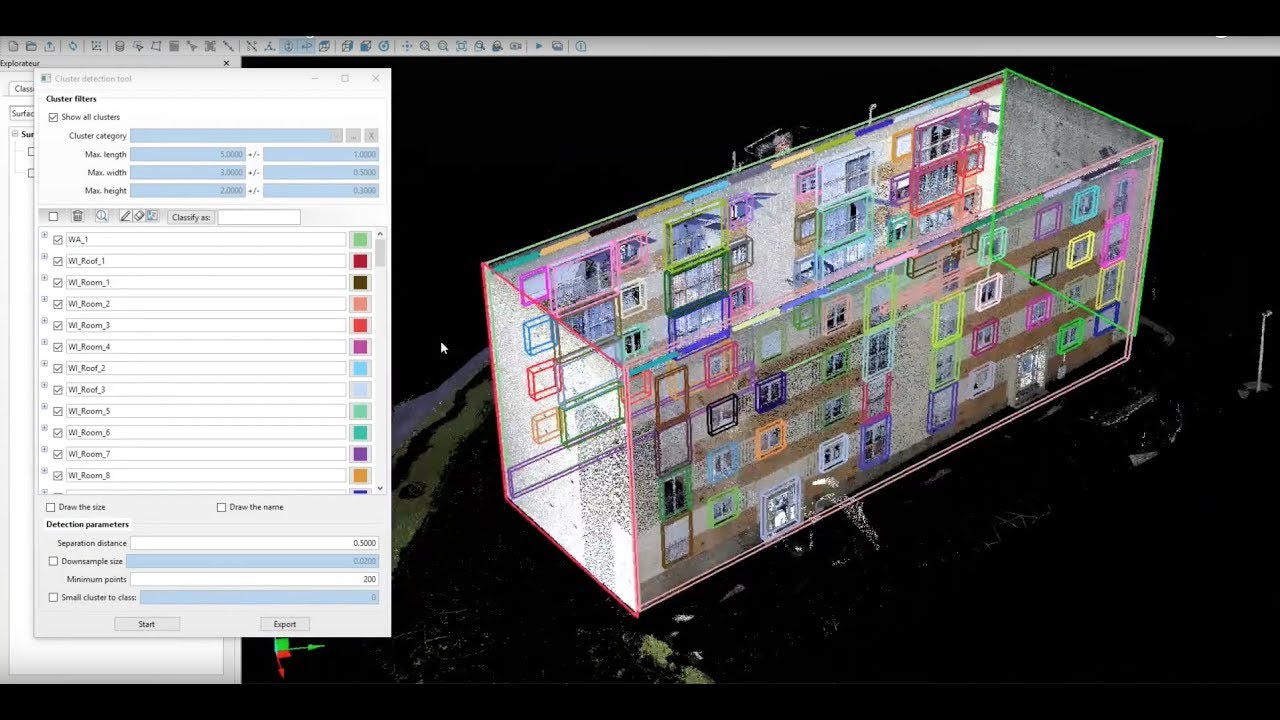
- Extract contour lines, surfaces, lamp posts, trees, sidewalks and buildings directly from the point cloud. Each object type is saved as a separate data layer for organized management and export
- Cross-section visualization enables easy digitization of 3D infrastructure objects with just a few clicks. Results are exported to CAD (.dxf) and GIS (.shp) formats
- Automatic detection of break lines, edges, pavement markings and guardrails. Data is exported directly to DXF or SHP format
- Volume calculation measures cut and fill quantities, material volumes and grading earthworks. Results are computed based on actual point cloud data
Dynamic 3D Fence Tool
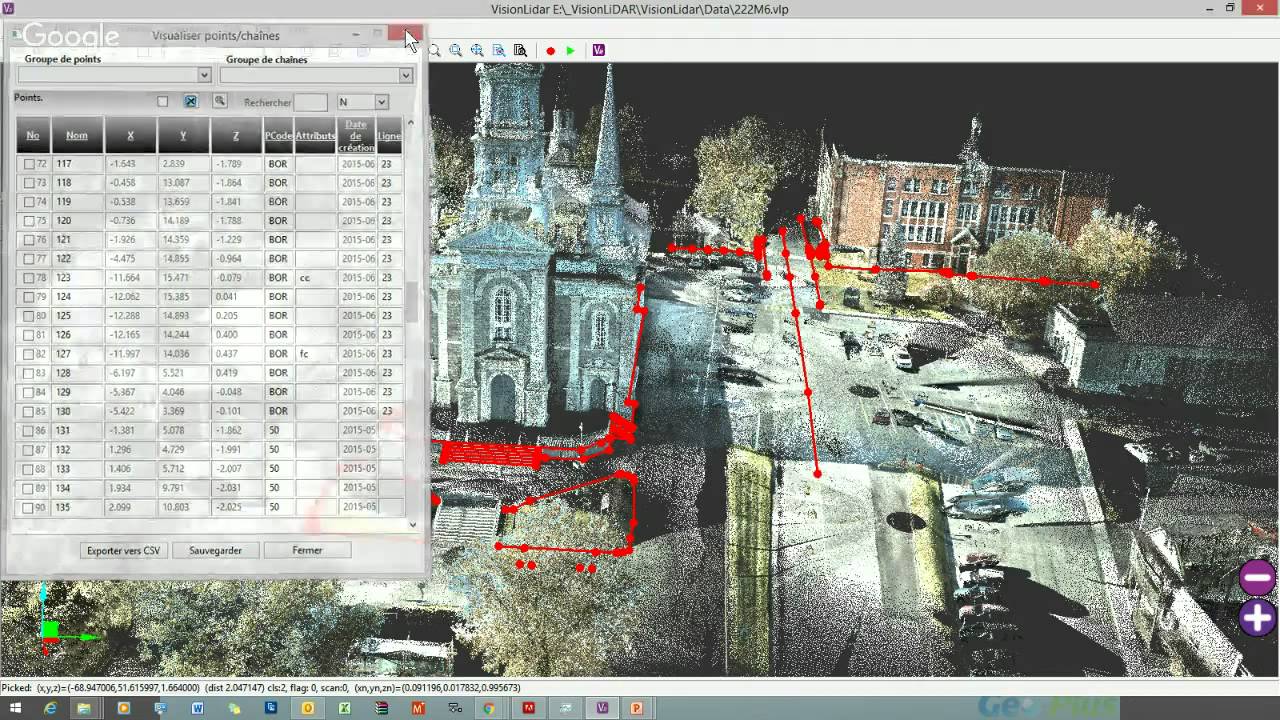
- The tool supports region selection by creating interior or exterior boundaries. Users can accurately delineate any portion of the point cloud for isolated analysis
- Saved selections can be reused with the following tools: editing, deleting, exporting, segmentation, classification, surface analysis, dendrometry, and cylinders and planes detection
- Export selected portions of the point cloud to .E57, .LAS, .LAZ and .PTS formats. These formats are compatible with most LiDAR processing software available on the market
Automated Tree Measurement (Dendrometry)
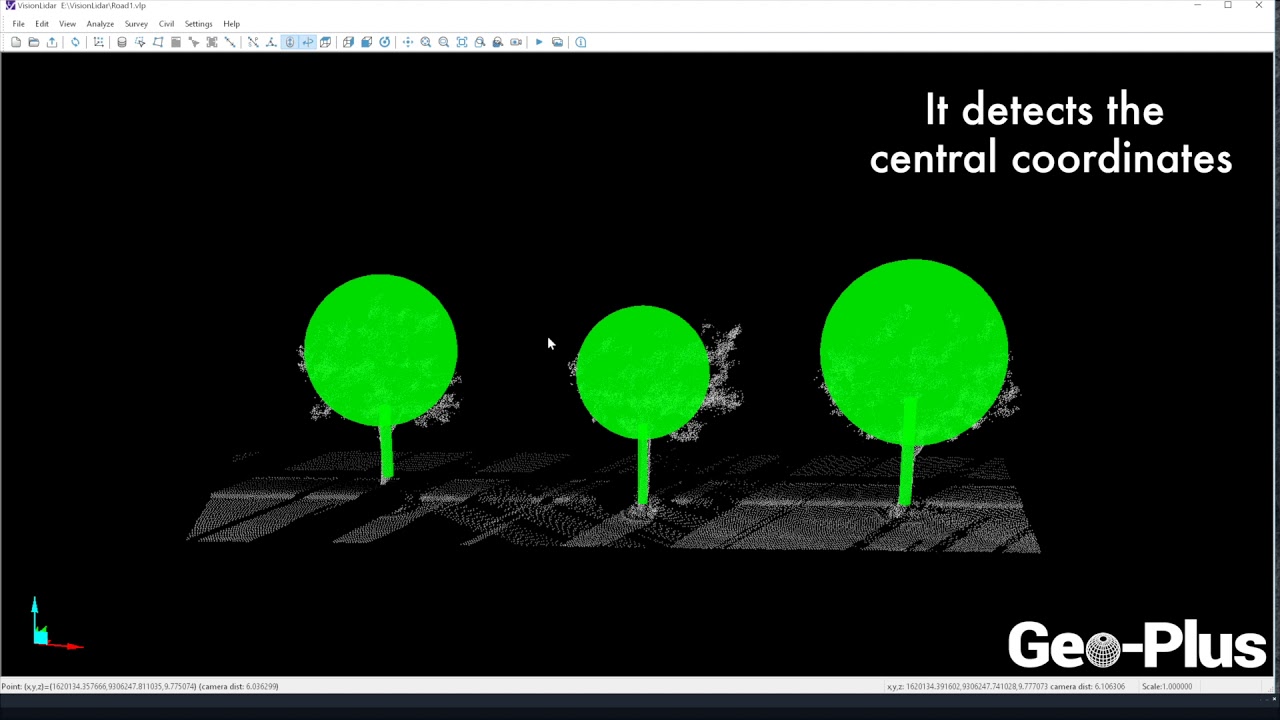
- When using the Dynamic 3D Fence to select a specific region within the point cloud, users can activate the dendrometry tool to automatically identify individual trees within that area. The software measures tree height, diameter at breast height (DBH), crown width and apex height
- Automatic detection of individual tree positions within the selected data area. Each tree is labeled and saved as a distinct object for organized data management and export
- Measurement data includes tree height, trunk diameter, crown width and apex height. Results are exported to CSV spreadsheet or shapefile format
Point Cloud Comparison & Analysis
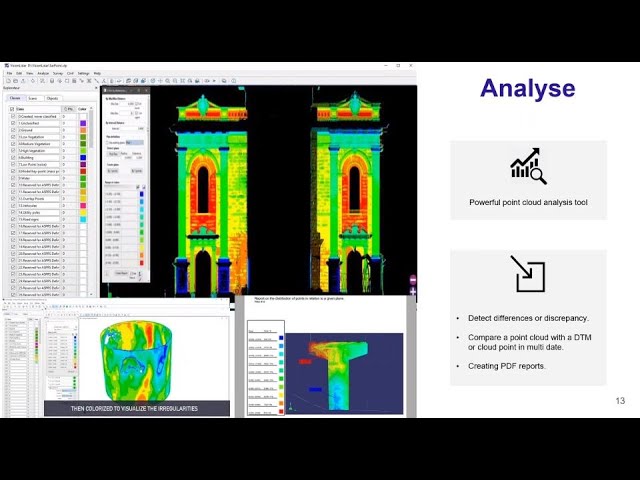
- Compare data between two LiDAR scans to find differences. The software computes distance and volume differentials between two time periods. Results are exported as PDF reports
- Surface versus point cloud comparison analysis evaluates the conformity between design models and actual as-built conditions
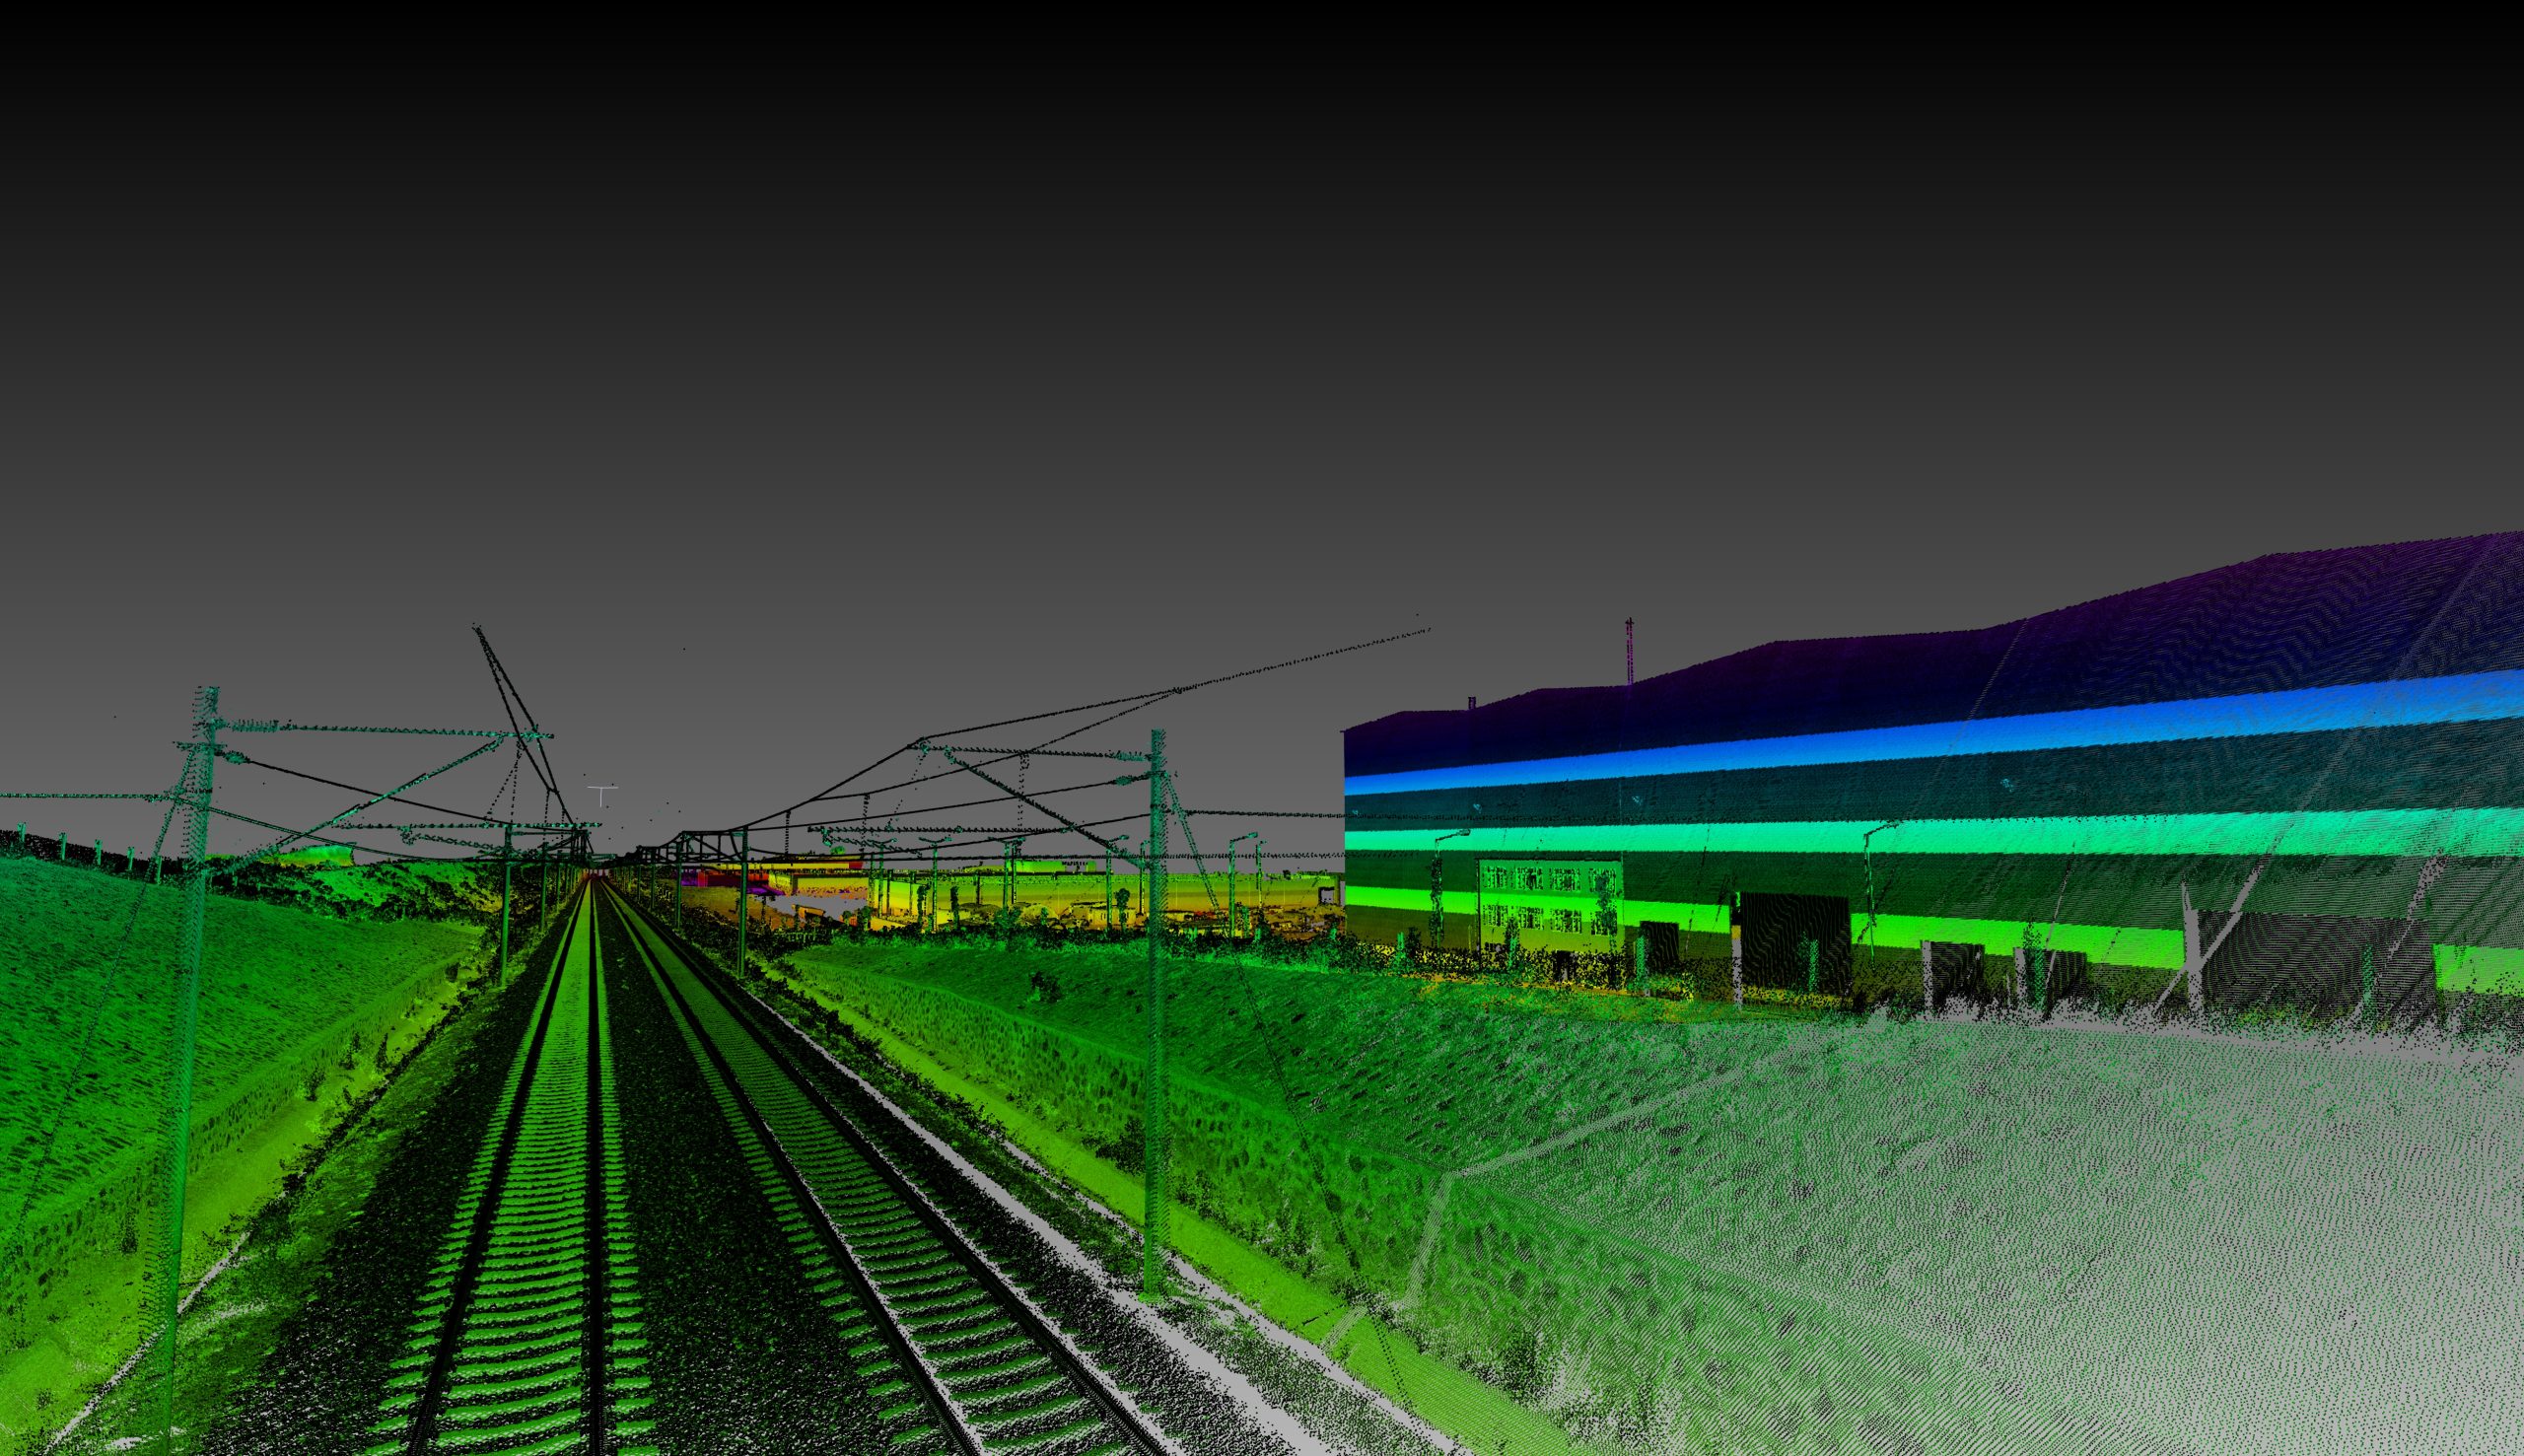
Shadow Casting and Surface Analysis
- The shadow casting feature applies to buildings, DTM or any structure. Users can visualize point cloud data in different colors to evaluate shape and surface details
- Surface analysis enables users to evaluate and visualize terrain geometry. Results are displayed using multiple color palettes for easy identification of elevation, slope and structural details
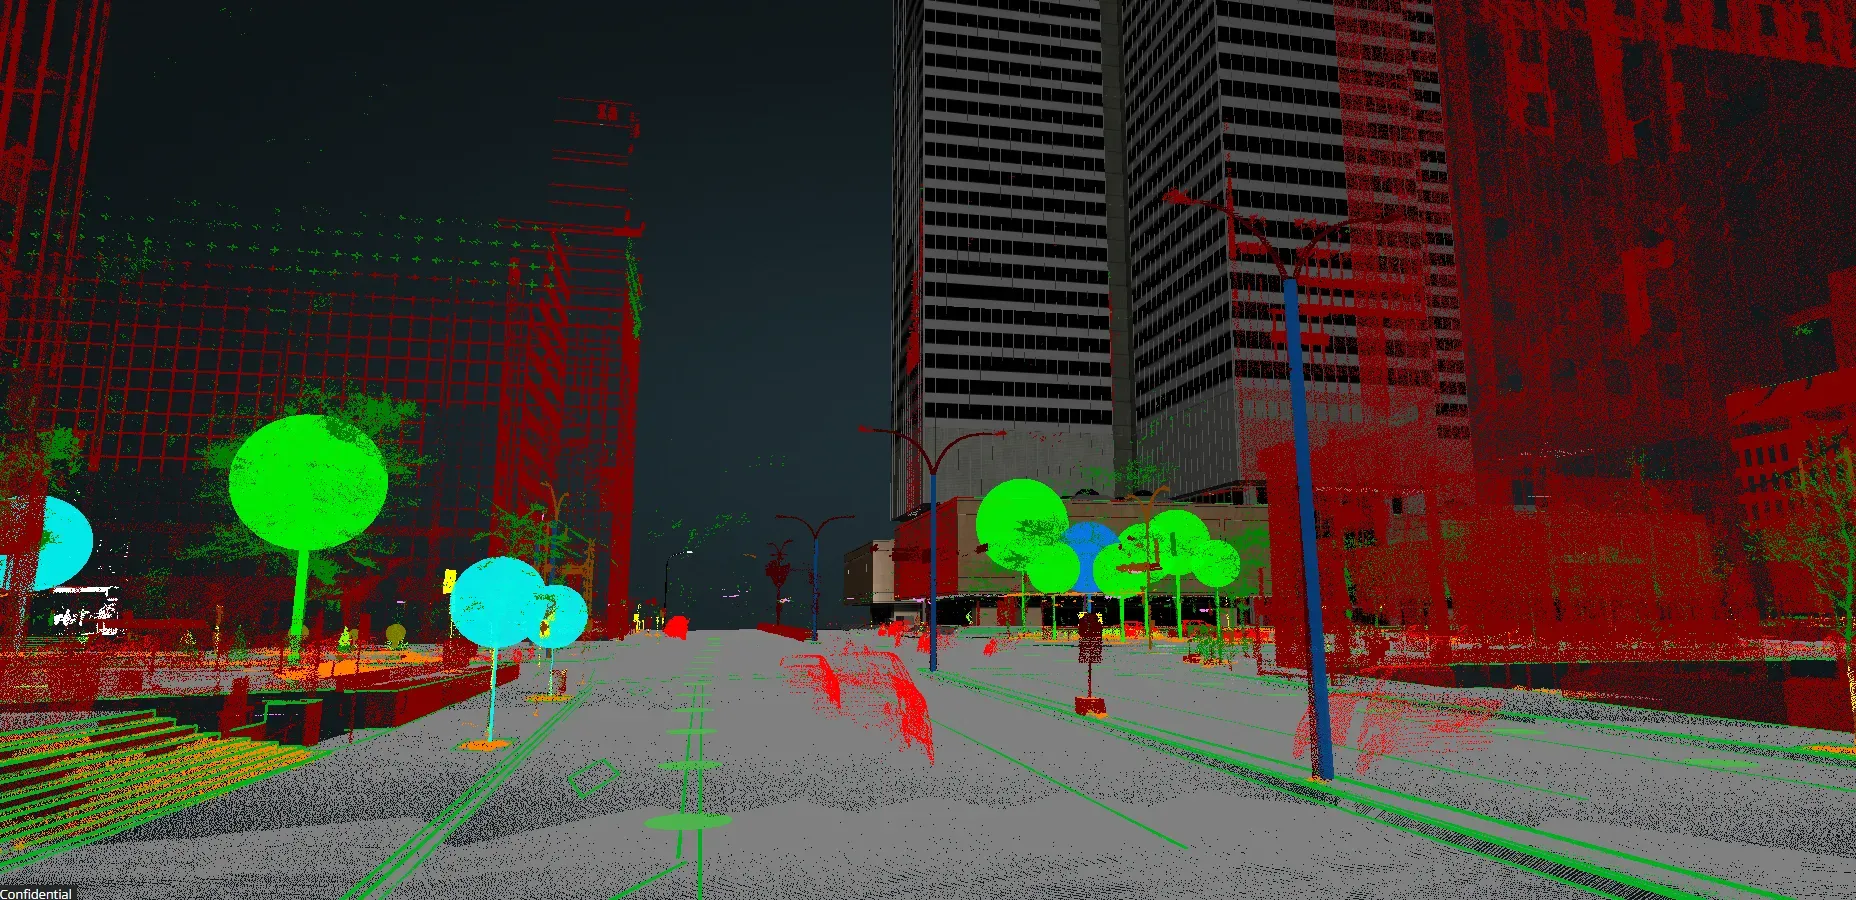
Multi-Layer Data Management
- Manage up to 128 plus data layers with naming conventions following DOT or CAD standards. Each layer can be independently displayed or hidden to focus attention on specific data regions of interest
- Process an unlimited number of points within a single project. VisionLidar uses a registration tool to merge point clouds from multiple sources without any constraints on data volume
- Merge and register data from multiple scans or multiple sensor sources into a unified dataset. This process ensures spatial continuity and accuracy across the entire project extent
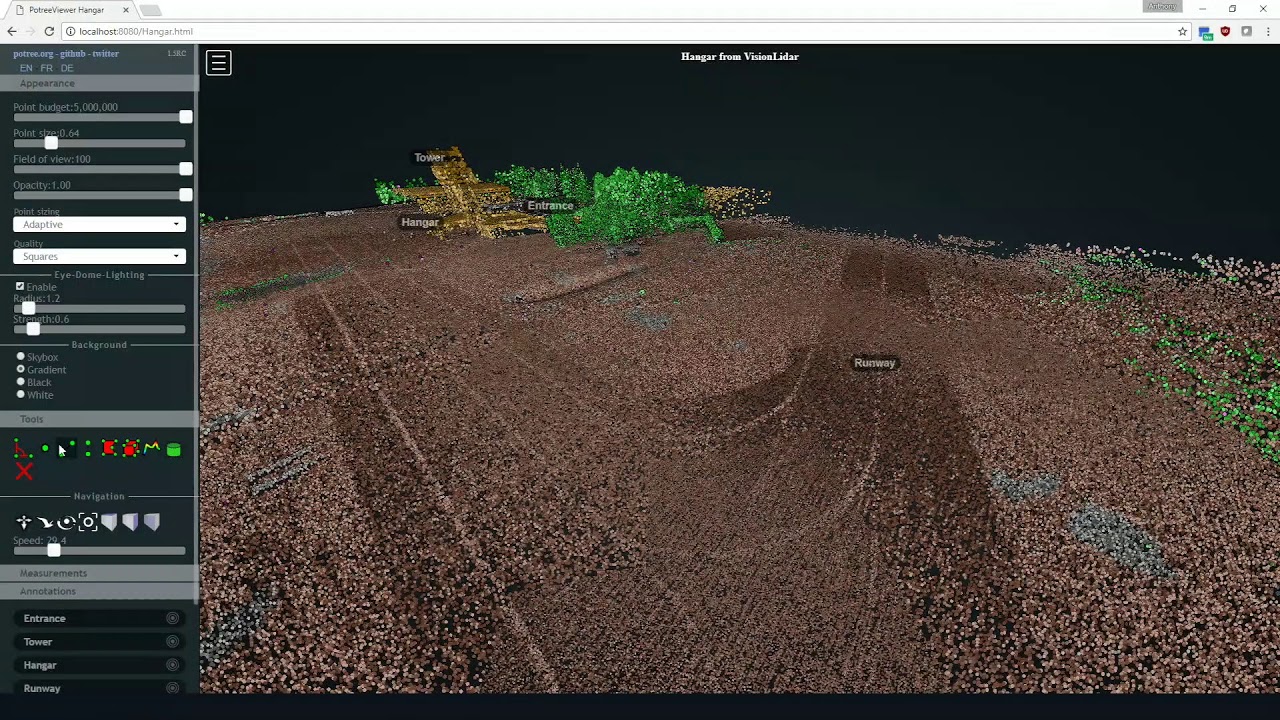
Export formats & extended integration
- Supports export to common CAD and GIS formats including DXF, SHP, GeoJSON, KML, MapInfo, CSV and LandXML. Each format serves specific use cases and target platform requirements
- Export and share point clouds in Potree web format. This format allows recipients to view, measure and compute directly in any web browser without installing specialized software
- Virtual Surveying tools use industry-standard methodologies. Engineers can perform virtual surveys on point cloud data and export results conforming to technical specifications
Visionlidar 365 online collaboration platform
- Share point cloud projects directly with clients through web links. Recipients can view 3D data, perform basic measurements and add annotations directly in their web browse
- The platform supports real-time team collaboration. Multiple users can access the same project simultaneously to evaluate, provide feedback and approve results
- Reduces turnaround time between stakeholders. Information is synchronized across all participants, ensuring everyone works on the latest version of the data
Core Values Of VisionLidar
Tangible benefits that VisionLidar delivers to the workflows of engineers and project managers
3x Faster Workflow Acceleration
- VisionLidar uses deep learning based object recognition to automatically classify points within the cloud. This process is 3 times faster than traditional manual classification methods
- Automated processing tools include noise reduction, feature extraction and break line detection. Users skip repetitive manual steps, saving hours on every project.
- The software focuses processing on the most important content of the project. Engineers can quickly eliminate noise and unnecessary data to concentrate on areas of interest.
Cost Optimization
- VisionLidar can replace more than 4 traditional standalone software solutions. Users invest in and maintain a single platform instead of multiple separate licenses.
- The integrated toolkit covers processing, analysis, digitization and data export. Every operation is performed within one interface without switching between different applications.
- Training and technical support costs are minimized when using a unified platform. Engineering teams only need to master a single system for the entire point cloud workflow.
ROI Within 3 Months
- Users can fully leverage their investment within 3 months of deployment thanks to an efficient workflow. The short payback period helps organizations reach breakeven quickly.
- Annotation creation and point cloud sharing in Potree web format accelerate the approval process. Clients and partners can view and measure data directly in any web browser.
- Native integration with CAD/GIS systems reduces data conversion time between workflow steps. Engineers export results directly to AutoCAD, ArcGIS or Microstation without intermediary processes.
Unlimited Data Capacity
- VisionLidar processes an unlimited number of points within a single project. The software imposes no volume ceiling, making it suitable for city-scale surveys or highway corridor projects.
- Simultaneous management of more than 128 data layers following DOT or CAD naming standards. Each layer can be independently named, color-coded and analyzed.
- The registration tool merges point clouds from different scanning sources. Data from multiple flights, multiple sensors or multiple time periods is unified into a single consistent dataset without format constraints.
Choose the VisionLidar package that matches your project scale and integration requirements
VisionLidar offers three editions with varying levels of functionality, from an entry-level package for smaller projects to the most comprehensive edition with full CAD/GIS integration and virtual surveying tools. Contact TrueTech for a detailed quotation based on your specific requirements.
- Provides a complete set of basic processing, classification and visualization tools for point cloud data. Users can load data, view in 3D, classify points and export results to common formats.
- Includes Deep Learning powered tools for automatic object classification. Engineers can leverage intelligent recognition capabilities even at the most accessible tier.
- Covers point cloud comparison, volume calculation and automated feature extraction. This is the ideal choice for teams beginning to implement professional LiDAR processing workflows.
- Designed as the most popular edition, Premium adds advanced tools that significantly exceed Standard capabilities. Users gain access to deeper analysis features and expanded automation workflows.
- Includes full object extraction tools, break line detection, edge detection, pavement markings and guardrail identification. Automation capabilities reduce manual operations substantially in daily processing routines.
- Supports point cloud sharing in Potree web format. Clients and partners can view, measure and compute directly in their web browser without installing specialized software.
- Integrates VisionLidar 365 online collaboration platform for remote teamwork. Multiple users can access the same project simultaneously to evaluate and approve results.
- Ultimate is the most expansive edition in terms of integrations and connectivity. Users connect directly to their favorite CAD/GIS platforms including AutoCAD MAP, AutoCAD, Civil 3D, ArcGIS, Microstation, Powerdraft and BricsCAD.
- Integrates complete Virtual Surveying tools using industry-standard methodologies. Engineers can perform measurements, create annotations and generate reports conforming to technical specifications directly on point cloud data.
- Supports data export to a wide range of formats including GeoJSON, KML, MapInfo, DXF, CSV and LandXML. Every output product is immediately ready for integration into any design, planning or acceptance verification workflow.
- Embeds 360-degree spherical images directly within the 3D interface. Users enhance environmental interpretation by combining LiDAR data with panoramic imagery in a single viewing environment.
- Includes all features from both Standard and Premium editions. Ultimate is best suited for organizations requiring an all-in-one solution with the broadest system connectivity.
Quick Comparison of Three Editions
| Criteria | Standard | Premium | Ultimate |
|---|---|---|---|
| Point cloud processing & analysis | |||
| Deep Learning classification | |||
| Point cloud comparison | |||
| Volume calculation | |||
| Automated feature extraction | |||
| Potree web sharing | |||
| VisionLidar 365 online collaboration | |||
| Pavement markings, guardrails, pole detection | |||
| CAD/GIS plugin integration | |||
| Virtual Surveying tools | |||
| 360-degree spherical images in 3D | |||
| GeoJSON, KML, MapInfo export |
Industry applications
Professional fields where VisionLidar solves specific geospatial data challenges

Land Surveying
- VisionLidar enables survey engineers to process the complete workflow from raw data to final deliverable in a single software. Registration tools merge data from multiple scans, volume calculations and contour line generation export directly to DXF or LandXML
- Virtual Surveying functionality supports remote measurement on point cloud data following industry standards. Engineers can perform measurements, create annotations and generate reports on point cloud data without relying on separate standalone tools
- Data export to multiple formats including DXF, SHP, CSV, GeoJSON and LandXML. Results are immediately ready for integration into any design or acceptance verification workflow

Urban Planning
- VisionLidar enables extraction of urban infrastructure objects including buildings, roads, sidewalks, trees and lamp posts. Each object is digitized and stored as a separate data layer for planning purposes
- Surface analysis and shadow casting tools help visualize point cloud data using different color palettes. Planners can evaluate shape and surface details directly on actual surveyed data
- Data is exported to SHP and KML formats for integration into urban management GIS systems

Forestry & Environment
- VisionLidar provides a dendrometry tool combined with the Dynamic 3D Fence for tree measurement. Forestry professionals can delineate specific areas and automatically identify individual trees to measure height, diameter at breast height (DBH), crown width and apex height
- Automatic detection of individual tree positions within the selected data area. Each tree is labeled and saved as a distinct object for organized data management and export
- Measurement data includes tree height, trunk diameter, crown width and apex height. Results are exported to CSV spreadsheet or shapefile format

Transportation Infrastructure
- VisionLidar supports automatic detection of lane markings, guardrails, light poles and edge features from mobile LiDAR corridor data. Information is digitized and stored as distinct object layers
- The comparison tool enables comparison of data between two LiDAR scans along a corridor. The software identifies differences and exports results as PDF reports
- Surface versus point cloud comparison analysis evaluates the conformity between design models and actual as-built conditions
- Automated break line and edge extraction generates accurate road surface models. Data is exported to LandXML and DXF format for use in highway and bridge design workflows

Construction
- VisionLidar enables comparative analysis between two point clouds or between a surface and a point cloud. Construction engineers can evaluate the conformity between as-built conditions and design data
- Volume calculation tools measure quantities directly from point cloud data. Results support acceptance verification, payment certification and schedule control
- Comparison results are exported as detailed PDF reports. Reports include deviation maps and statistical data tables

Energy & Utilities
- VisionLidar supports automatic pole detection from point cloud data. Pole position and geometry information is digitized and stored as a dedicated data layer
- Point cloud data supports power line corridor safety assessment. Utility companies can detect vegetation encroachment into right-of-way protection zones and evaluate phase clearances
- Data is exported to CAD or GIS formats for integration into power grid asset management systems
Frequently Asked Questions
VisionLidar is a professional LiDAR point cloud processing software developed by Geo-Plus. It integrates a complete suite of processing, classification, analysis and data export tools. According to the manufacturer, VisionLidar can replace more than 4 standalone software solutions in a single unified platform
The software supports export to multiple industry-standard formats including DXF, SHP, GeoJSON, KML, MapInfo, CSV and LandXML. Additionally, users can share point clouds in Potree web format, enabling viewing and measurement directly in any web browser.
Yes. VisionLidar provides dedicated plugins for AutoCAD MAP, AutoCAD, Civil 3D, ArcGIS, Microstation, Powerdraft and BricsCAD. Users can view, measure and operate directly on point cloud data within their familiar CAD/GIS environment.
VisionLidar uses semantic segmentation powered by deep learning to automatically identify and classify objects within point cloud data. Users can create custom models tailored to their specific sensor type and unique project requirements.
The software processes an unlimited number of points within a single project. A registration tool merges data from multiple scanning sources. The system manages more than 128 data layers simultaneously, making it suitable for city-scale or long corridor projects.
Yes. Geo-Plus provides a limited trial version. You can visit the VisionLidar product page at TrueTech or contact us directly to receive a download link and experience the core features before making an investment decision.
VisionLidar 365 is an online collaboration platform for sharing point cloud data via web browser. Users can invite clients and colleagues to view, measure and provide feedback directly on the project without installing specialized software.
VisionLidar offers three feature packages suited to different scales and requirements. Standard covers essential needs, Premium adds advanced tools, and Ultimate provides full CAD/GIS connectivity and extended features. Contact TrueTech for personalized consulting on the most suitable package.
Contact TrueTech for consulting & quotation
Connect with TrueTech's expert team to get personalized VisionLidar solution recommendations

