Document

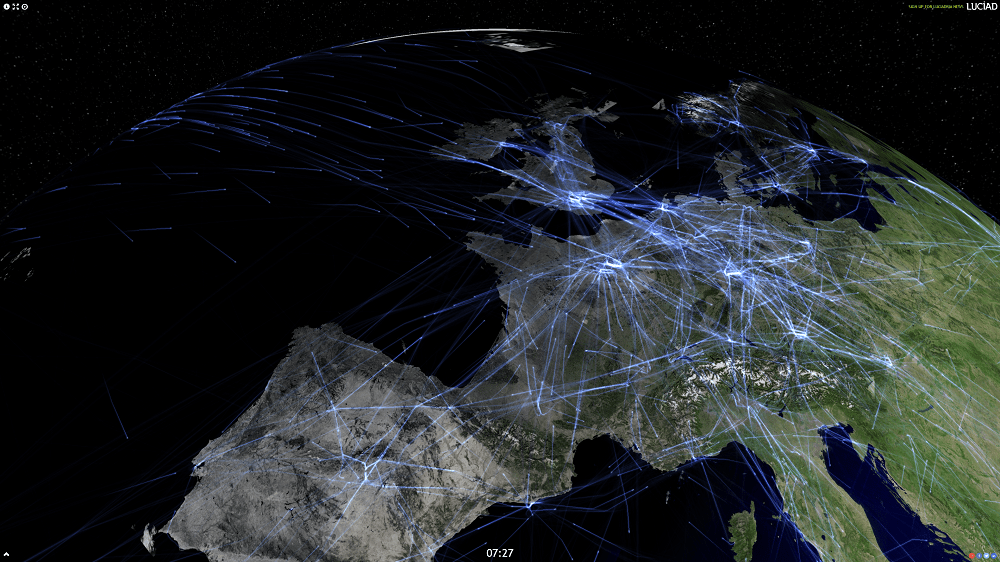
Driven by today’s most advanced web technologies, LuciadRIA uses WebGL, HTML5, and JavaScript to deliver desktop-like performance to your web applications. With LuciadRIA, you can expect high performance and complete accuracy, with desktop-like visualization of satellite and other imagery, vector-based data, and dynamic content, such as tracks.

Connect to your data via OGC web services, or simply drag and drop common file formats. The data can then be explored in a 2D or 3D map view or a vertical intersection view. For 4D analysis and a richer picture of what’s happening when, combine it with a timeline view.

Why You Should Choose LuciadRIA:

➔ Fuse multi-source content into a smart digital reality.

➔ Handle real-time dynamic data, such as flights, vessels, or people.

➔ Enjoy the interactivity of a desktop solution, including analytics, right in the browser.

➔ Deal with data and maps in different projections without extract-transform-load (ETL) processing.

➔ Work with defense symbology, including MIL-STD-2525 and APP-6, in a browser application.

Capabilities

From 2D to 3D with the Click of a Button

Clean design matters. LuciadRIA is the only web-based geospatial solution that allows users to go from 2D to 3D, using the same code and data, in a beautiful, intuitive interface.

Fully Leverage HTML5 Technology

Rely on world-scale precision to visualize, transform, and calculate data. Using HTML5, LuciadRIA provides high-performance imagery alongside vector-based data and dynamic content.

Accelerated Visualization Done Right

Develop applications for 2D and 3D through a single API. LuciadRIA supports 3D and advanced visualization thanks to hardware acceleration with WebGL technology.

Ideal for Mission-Critical Work

Visually analyze millions of events or locations directly from a browser. LuciadRIA handles geospatial data with the speed and accuracy required for mission planning.

Focus on Customizability and Integration

Easily develop for networked and cloud-based environments. LuciadRIA enables you to integrate other Rich Internet Applications and to create interactive browser-based interfaces.

Nghiên cứu tình huống

Integrytis Visualises the Impact of Pollution on Public Health

After France experienced an unusually high peak of air pollution due to cold weather and windless conditions, Integrytis, a French data intelligence company, built a tool to visualize the impact of air pollution on public health in real time using a map. By correlating data on respiratory diseases from their customer, a French Mutual health company, with data from over 400,000 sensors providing data including air quality, weather, and wind patterns, the company can see the true impact of atmospheric pollution on respiratory diseases over time, in real time and for every region in France. In addition, citizens and health organizations can easily see on a map the impact of specific health issues across their country.

Read more »

000071129 624x337 c